How much is too much?
On this page
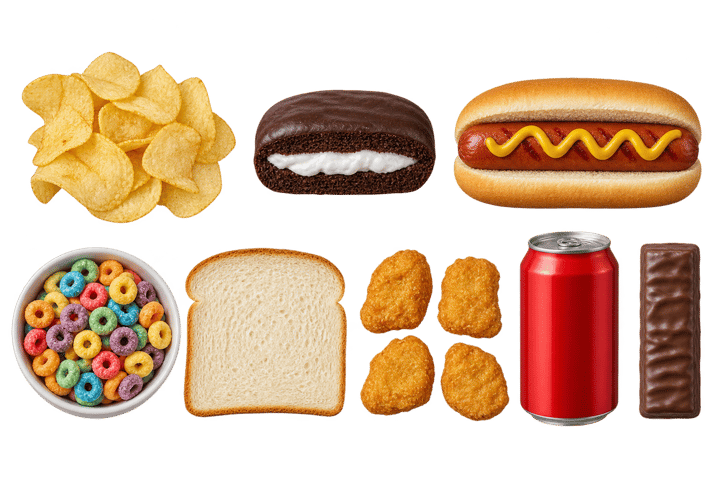
No US guideline sets a share of calories to stay under. US adults get 53% of their calories from ultra-processed food, and children and teens 61.9%. We use meals.guide’s plate line, no more than 30% of a plate’s calories, as an everyday mark, and the foods that make up the share count for more than the exact number.
What we’d do
Aim for a normal day where most of what you eat is groups 1 to 3, roughly under 30% of calories from group 4, and get there by swapping the two or three packaged staples you eat every day. Don’t count every bite. A day can include a fully ultra-processed sandwich and still come in under 30% when breakfast, dinner and the snack are kitchen food.
If you remember three things
- There’s no official number. The 2025 to 2030 Dietary Guidelines say to avoid highly processed salty and sweet foods, and set no share.
- The US average is 53% for adults. Children aged 6 to 11 eat the most, at 64.8%.
- Under 30% doesn’t mean cooking everything. One swap, a sandwich for a rice and bean bowl, took one typical day from 57% to 29%.
Why people want a number
Once you know what ultra-processed means, the next question is how much is fine. People want a line they can stay under, so they can stop worrying about the rest.
Nobody official has drawn that line for ultra-processed food. The 2025 to 2030 US guidelines tell Americans to avoid highly processed food, and they name foods to avoid without giving a share of the day.
What the US guidelines say
The 2025 to 2030 Dietary Guidelines for Americans mention highly processed food on most of their ten pages. They say to:
- avoid highly processed packaged, prepared or ready-to-eat foods that are salty or sweet, such as chips, cookies and candy (p. 4)
- significantly reduce highly processed refined carbohydrates, such as white bread, packaged breakfast options, flour tortillas and crackers (p. 3)
- limit foods and drinks with artificial flavors, petroleum-based dyes, artificial preservatives and low-calorie sweeteners (p. 4)
- avoid sugar-sweetened drinks, and keep any one meal to no more than 10 grams of added sugar (p. 4)
They never say what “highly processed” means, and they give no percentage. That leaves NOVA, the system researchers use, and the averages it produces.
How much Americans eat
The CDC counted it for August 2021 to August 2023, using NOVA and the national nutrition survey.
| Group | Share of calories from ultra-processed food |
|---|---|
| Everyone age 1 and up | 55.0% |
| Children and teens, 1 to 18 | 61.9% |
| Ages 1 to 5 | 56.1% |
| Ages 6 to 11 | 64.8% |
| Ages 12 to 18 | 63.0% |
| Adults, 19 and up | 53.0% |
| Adults 19 to 39 | 54.4% |
| Adults 40 to 59 | 52.6% |
| Adults 60 and up | 51.7% |
Adults have come down a little, from 55.8% in 2013 to 2014. Adults in families with the highest incomes ate the least, 50.4%, against about 55% for everyone else. Men and women ate about the same.
The top five sources for adults, as a share of all the calories they ate:
| Source | Share of all calories, adults | Share of all calories, ages 1 to 18 |
|---|---|---|
| Sandwiches, including burgers | 8.6% | 7.6% |
| Sweet bakery products | 5.2% | 6.3% |
| Sweet drinks | 4.4% | 3.9% |
| Salty snacks | 3.4% | 4.9% |
| Bread, rolls and tortillas | 3.1% | not in the top five |
| Pizza | not in the top five | 4.7% |
Sandwiches and burgers carry about twice the ultra-processed calories that sweet drinks do. Most of America’s ultra-processed food is everyday meals and bread, which is why swapping staples works better than giving up treats.
Where the 30% comes from
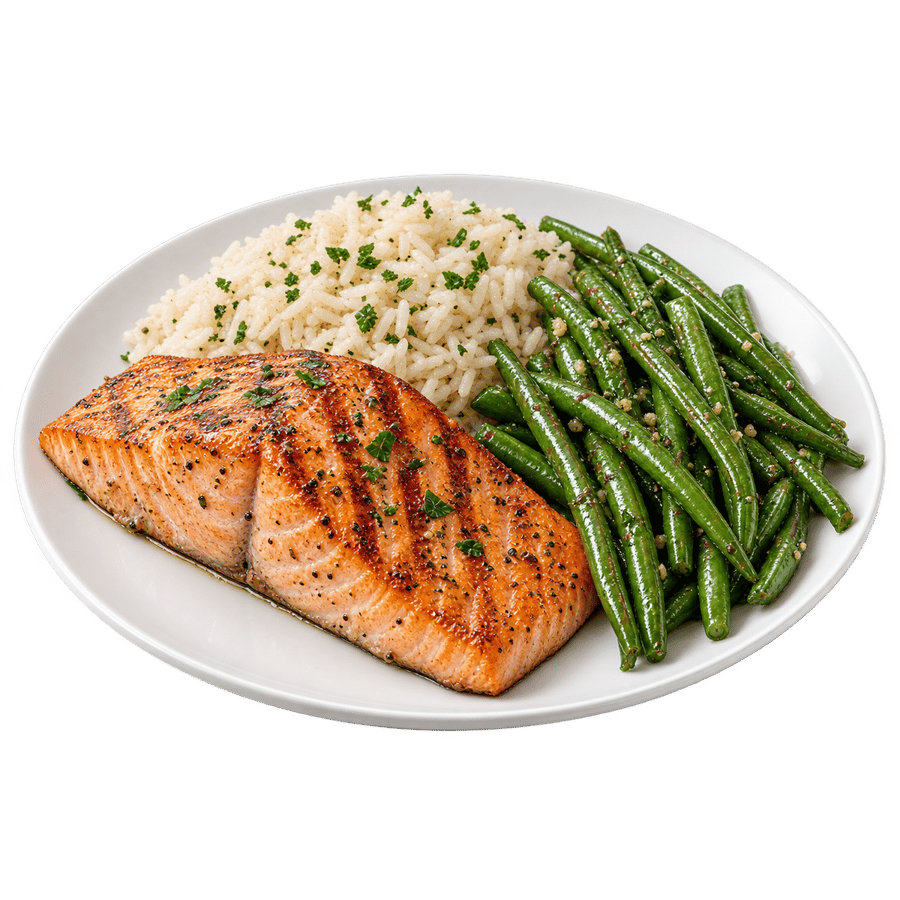
meals.guide grades a plate on six checks, and one of them is no more than 30% of the plate’s calories from ultra-processed food. We use the same line here so a plate gets the same answer on both sites.
It isn’t a guideline, and no study has set a safe threshold at 30% or anywhere else. We use it because it’s well under the US average, it’s reachable with two or three swaps, and it still leaves room for a packaged whole wheat loaf, a shake or a bar that does a job for you. Think of it as an everyday mark to see where you are, the way you might use 10,000 steps.
The trials ran much further apart than that. On the NIH ward the ultra-processed menu got about 83.5% of its calories from ultra-processed food and the unprocessed menu none. In the England trial, people signed up only if they usually ate at least 50% of their calories from it.
What a day under 30% looks like
These days are built from the quiz’s typical plates, using the same USDA table and the same rule as the checker: calories from group 4 over all calories.
| Breakfast | Lunch | Dinner | Snack | Drink | Calories | Share |
|---|---|---|---|---|---|---|
| Eggs and whole wheat toast | Chicken, rice and bean bowl | Spaghetti with meat sauce you make | Almonds | Water | 1,424 | 10% |
| Greek yogurt and berries | Big salad with chicken and bottled dressing | Tacos you make | Cheese | Water | 1,015 | 14% |
| Oatmeal and a banana | Turkey sandwich on packaged bread | Chicken, rice and broccoli | An apple | Water | 1,045 | 28% |
| Corn flakes and milk | Turkey sandwich on packaged bread | Chicken, rice and broccoli | Chips | Soda | 1,237 | 57% |
The third day has a sandwich that’s 100% ultra-processed, deli turkey, packaged bread and mayonnaise, and still lands at 28%. The fourth day has the same sandwich and dinner, and the cereal, chips and soda push it to 57%. Swap that sandwich for the rice and bean bowl and the day goes to 29%.
A diet soda doesn’t change any of these numbers, since it has almost no calories. It’s still group 4, for its sweetener, color and flavors.
Does the exact number matter?
In the big studies, more goes with more risk. A 2023 analysis of 415,554 people found each extra 10% of the diet from ultra-processed food went with 12% higher risk of type 2 diabetes.
But the same researchers found the foods inside the share pointed in different directions. Sweet drinks, processed meat and refined bread went with higher risk, and whole grain bread, cereal and yogurt with lower risk. A day at 35% made of whole wheat toast and yogurt is a different day from 35% made of soda and hot dogs. Get the share down by cutting the sweet drinks, processed meat and refined bread first, and the number will follow.
Kids
Children and teens eat more ultra-processed food than adults, 61.9% of their calories, and it peaks at 64.8% for ages 6 to 11. Their top sources are sandwiches and burgers, sweet bakery, salty snacks and pizza. Swap the lunchbox and the breakfast bowl first, and keep the changes free of food fear. How much ultra-processed food do kids eat? has more.
Find your own share
- Your day’s share: pick what you eat at each meal and get your share beside the US averages, and the meal that carried most of it.
- The quiz: seven taps with pictures, your share for a day like yours, and your three easiest swaps.
6 sources
- Williams et al., Ultra-processed food consumption in youth and adults: United States, August 2021 to August 2023, NCHS Data Brief 536, 2025cdc.gov
- US Departments of Agriculture and Health and Human Services, Dietary Guidelines for Americans, 2025 to 2030cdn.realfood.gov
- Chen et al., Ultra-processed food consumption and risk of type 2 diabetes: three large prospective U.S. cohort studies, Diabetes Care, 2023pmc.ncbi.nlm.nih.gov
- Hall et al., Ultra-processed diets cause excess calorie intake and weight gain: an inpatient randomized controlled trial of ad libitum food intake, Cell Metabolism, 2019pmc.ncbi.nlm.nih.gov
- Dicken et al., Ultraprocessed or minimally processed diets following healthy dietary guidelines on weight and cardiometabolic health: a randomized, crossover trial, Nature Medicine, 2025pmc.ncbi.nlm.nih.gov
- Gebhardt and Thomas, Nutritive Value of Foods, USDA Home and Garden Bulletin 72, 2002ars.usda.gov