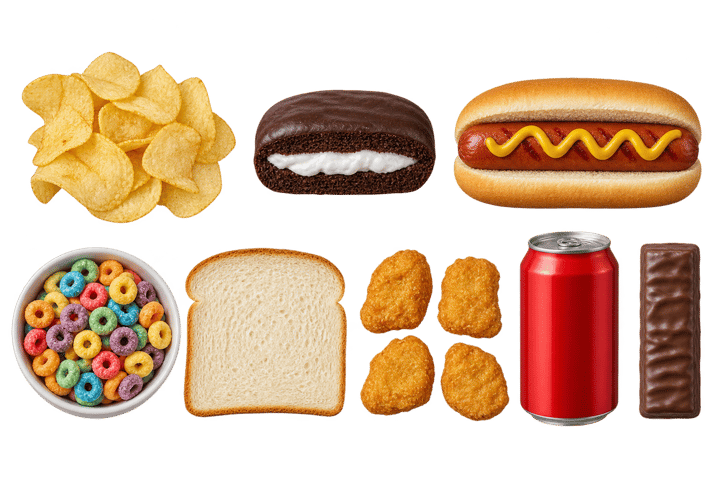
Is this food ultra-processed?
Pick a food or a whole plate from the list and set the amounts. Each food shows its group and what decided it, and the plate shows its share of calories from ultra-processed food.
Nothing here yet. Pick a food below.
What your result means
Pick one real plate, like yesterday's lunch, with the amounts you ate. Each food shows its group and the one ingredient that decided it, and the bar shows the plate's share of calories from ultra-processed food.
- Under 30%. Most of the plate is food a kitchen could make, under meals.guide's plate line. Keep it.
- 30% to 53%. Between the plate line and the US adult average. One swap usually takes it under the line, and the swap shown is the one that drops it most.
- Over 53%. More than the average American day. Look at which food carries the most calories. On most plates it's the bread, the meat or the drink.
- Check the nutrition line too. A plate can be 100% group 4 and still bring protein and fiber, like a whey shake with whole wheat toast. The share is one fact about the plate, never its grade.
Then try the swap, check the actual package with the label checker, and grade the whole plate on meals.guide, where Processing is one of six checks.
How NOVA's test works
NOVA sorts food by how it's made, in four groups, and leaves nutrition out. The test for group 4 is one question about the label: is there at least one ingredient a home kitchen doesn't keep? Table sugar, salt and oil don't count. High-fructose corn syrup, maltodextrin, whey protein, emulsifiers and flavorings do.
| Group | Our name | What it means |
|---|---|---|
| 1 | Whole or barely changed | The food itself, washed, frozen, dried, pasteurized or fermented. Plain oats, frozen peas, milk, plain yogurt, dried pasta. |
| 2 | Kitchen ingredient | Salt, sugar, oils, butter, honey: things you cook group 1 food with. |
| 3 | Processed | Group 1 food with a kitchen ingredient added. Cheese, canned beans, canned tuna, a loaf of flour, water, salt and yeast. |
| 4 | Ultra-processed | Has at least one ingredient a kitchen doesn't keep: a sugar like high-fructose corn syrup or maltodextrin, a protein isolate like whey, a hydrogenated oil, or a flavoring, color, emulsifier, sweetener or thickener. |
Every food in the checker has its group tagged in our table, the same tags meals.guide uses, so a plate's share is the same on both sites. A food is picked from the list, never guessed from what you type. For a package that isn't in the list, paste its ingredients in the label checker.
The share is the plate's calories from group 4 foods over all its calories. The bar marks meals.guide's plate line, no more than 30% of a plate's calories from ultra-processed food, and the US adult average, 53.0% of calories (CDC, 2021 to 2023). No US guideline sets a share to stay under.
The swap comes from trying each swap in our list on your plate and keeping the one that drops the share most. It shows what that does to protein, fiber and added sugar, so a swap that costs you protein says so. To grade the whole plate on protein, plants, fiber, sugar and size, use meals.guide.
Four plates, worked
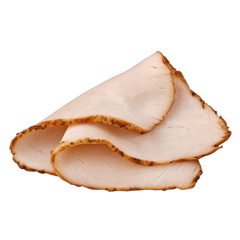
Turkey sandwich100%
300 calories, 100% of them ultra-processed. 14 g protein, 3.8 g fiber.
Swap the deli turkey for roast turkey: 70%, and protein goes from 14 g to 25 g. A second swap, the mayo for avocado, takes it to 53%.
The bread is still group 4. It has about three times the fiber of white, and the swap ladder shows the loaf that isn't group 4.
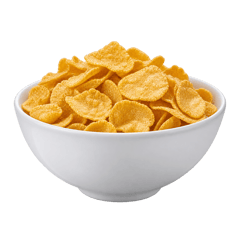
Cereal and milk46%
220 calories, 46% of them ultra-processed. 10 g protein, 0.8 g fiber.
Swap the corn flakes for oatmeal: 0%, and protein goes from 10 g to 14 g, fiber from 0.8 g to 4 g.
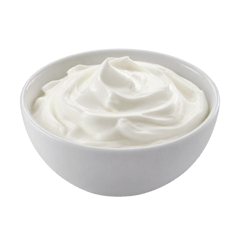
Fruit yogurt100%
230 calories, 100% of them ultra-processed. 10 g protein, 0 g fiber.
Swap the fruit yogurt for plain Greek yogurt and blueberries: 0%, and protein goes from 10 g to 18 g, fiber from 0 g to 2 g.
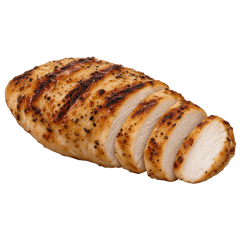
Chicken, rice and broccoli0%
410 calories, 0% of them ultra-processed. 42 g protein, 2.8 g fiber.
Nothing on this plate a kitchen wouldn't keep.
Where the numbers come from
Food values are from the USDA's Nutritive Value of Foods (Home and Garden Bulletin 72), the same table meals.guide uses, with a few rows from the USDA's Standard Reference and the FDA. The deciding ingredient for each group 4 food is the one most US labels of that food list. Your label decides, so check it in the label checker.
The group is a fact about how a food is made, not a grade. In 198,636 US adults, whole grain bread, cereal and yogurt, all group 4, went with lower diabetes risk, while sweet drinks and processed meat went with higher (Chen 2023). That's why the nutrition sits beside the group, on its own line.
5 sources
- Monteiro CA, Cannon G, Levy RB, et al. Ultra-processed foods: what they are and how to identify them. Public Health Nutrition, 2019pmc.ncbi.nlm.nih.gov
- Williams AM, Couch CA, Emmerich SD, Ogden CL. Ultra-processed food consumption in youth and adults: United States, August 2021 to August 2023. NCHS Data Brief No. 536, 2025cdc.gov
- US Department of Agriculture and US Department of Health and Human Services. Dietary Guidelines for Americans, 2025 to 2030cdn.realfood.gov
- Gebhardt SE, Thomas RG. Nutritive Value of Foods. USDA ARS, Home and Garden Bulletin 72, 2002ars.usda.gov
- Chen Z, Khandpur N, Desjardins C, et al. Ultra-processed food consumption and risk of type 2 diabetes: three large prospective US cohort studies. Diabetes Care, 2023pmc.ncbi.nlm.nih.gov
More tools

For adults looking at what they eat. It explains how food is made and doesn't grade your food or diagnose anything.