How much of your day is ultra-processed?
Pick what you eat at each time of day and the portion. You get your share of calories from ultra-processed food beside the US averages, and the meal that carried most of it.
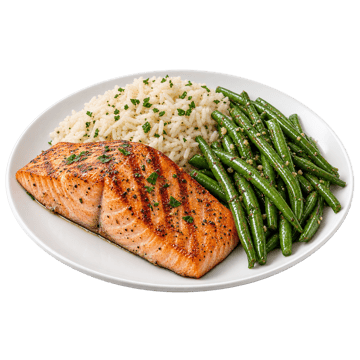
1,237 cal, 68 g protein, 8.7 g fiber, 39 g added sugar
Your lunch carried 42% of it, and the one food that carried the most was potato chips (152 calories).
No US guideline sets a share to stay under. The 2026 guidelines say to avoid highly processed salty and sweet foods. We use meals.guide's plate line, 30%, as an everyday mark.
The quiz builds your three easiest swaps from the same picks.
What your result means
Pick a normal day, not your best one. Each pick is a typical plate, so treat the share as a rough number for a day like yours.
- Under 30%. Under meals.guide's everyday plate line. Most of what you eat is food a kitchen could make.
- 30% to 53%. Below the US adult average and above the line. The meal named under the bar is where a swap moves it most.
- Over 53%. Above the average American day. Start with the meal that carried the most and the one item named in it.
No US guideline sets a share to stay under, so the line is an everyday mark, not a target. Swap the named item on the swap ladder, and come back in a week. The quiz turns the same picks into your own short guide.
How it works
Each pick is a typical plate built from our food table, the same portions as the quiz. Your share is the calories from group 4 foods over all the day's calories, the same rule meals.guide uses for a plate. A drink with almost no calories, like diet soda, barely moves the share even though it's group 4.
How much Americans eat
Share of calories from ultra-processed food, August 2021 to August 2023 (CDC):
| Who | Share of calories |
|---|---|
| Everyone age 1 and up | 55.0% |
| Ages 1 to 18 | 61.9% |
| Ages 1 to 5 | 56.1% |
| Ages 6 to 11 | 64.8% |
| Ages 12 to 18 | 63.0% |
| Adults 19 and up | 53.0% |
| Ages 19 to 39 | 54.4% |
| Ages 40 to 59 | 52.6% |
| Ages 60 and up | 51.7% |
The biggest sources, as a share of all calories:
| Source | Adults | Ages 1 to 18 |
|---|---|---|
| Sandwiches, including burgers | 8.6% | 7.6% |
| Sweet bakery products | 5.2% | 6.3% |
| Sweetened drinks | 4.4% | 3.9% |
| Savory snacks | 3.4% | 4.9% |
| Breads, rolls and tortillas | 3.1% | not in the top five |
| Pizza | not in the top five | 4.7% |
Sandwiches and burgers carry more of America's ultra-processed calories than soda does. That's why swapping the bread and the deli meat you buy every week moves the share more than giving up a treat.
4 sources
- Williams AM, Couch CA, Emmerich SD, Ogden CL. Ultra-processed food consumption in youth and adults: United States, August 2021 to August 2023. NCHS Data Brief No. 536, 2025cdc.gov
- US Department of Agriculture and US Department of Health and Human Services. Dietary Guidelines for Americans, 2025 to 2030cdn.realfood.gov
- Monteiro CA, Cannon G, Levy RB, et al. Ultra-processed foods: what they are and how to identify them. Public Health Nutrition, 2019pmc.ncbi.nlm.nih.gov
- Gebhardt SE, Thomas RG. Nutritive Value of Foods. USDA ARS, Home and Garden Bulletin 72, 2002ars.usda.gov
More tools

For adults looking at what they eat. It explains how food is made and doesn't grade your food or diagnose anything.