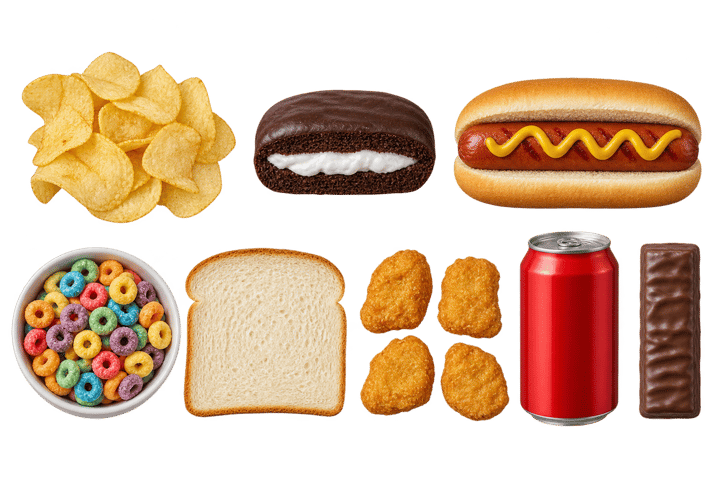
Processing isn't the same thing as nutrition
On this page
The NOVA group tells you how a food was made, and nothing about its protein, fiber or sugar. Packaged whole wheat bread and cola are both group 4. That’s why this site shows the group, the share of calories and the nutrition as separate lines, and never turns processing into a score.
What we’d do
Use the group to find swaps, and the nutrition to choose between them. When two foods share a group, pick the one with more protein and fiber and less added sugar. When a group 4 food does a job for you that nothing else does, like a whole wheat loaf your kids will actually eat or a whey shake that replaces a pastry, keep it and swap something else.
If you remember three things
- The same group holds very different food. Two slices of packaged whole wheat have 3.8 g of fiber, and two of packaged white have 1.2 g.
- In a study of 198,636 Americans, group 4 split down the middle. Whole grain bread, cereal and yogurt went with less type 2 diabetes, and sweet drinks and processed meat with more.
- Experts often disagree on the group itself. A score built on it would carry that doubt into every number.
Why people want a score
A single grade feels easy. Point your phone at a box, get a letter or a color, and put it back or keep it. It’s tempting to turn NOVA’s four groups into a scale from good to bad.
The trouble is what the scale has to ignore. Group 4 holds soda, candy and hot dogs. It also holds packaged whole wheat bread, protein powder, breakfast cereals and fruit yogurts. A score from the group puts all of them on the same rung, and a score that tries to fix that by mixing in nutrition stops being about processing at all.
This site keeps them apart. The group is a fact about how the food was made. The nutrition is a set of numbers you can compare. You can weigh them yourself.
Like the country of manufacture
The group works like the “made in” line on a product. It tells you something real about how a thing was put together, and plenty of people care about it. But you’d still look at what’s inside before deciding whether to buy it, and two things made in the same place can be very different.
Same group, different food
Here are foods from the site’s own table, each with its group and its nutrition per serving (USDA figures).
| Food, serving | Group | Calories | Protein | Fiber | Sugar added |
|---|---|---|---|---|---|
| Packaged white bread, 2 slices | 4 | 134 | 4 g | 1.2 g | 0 g |
| Packaged whole wheat bread, 2 slices | 4 | 138 | 6 g | 3.8 g | 0 g |
| Bakery sourdough, 2 slices | 3 | 138 | 4 g | 1.6 g | 0 g |
| Corn flakes, 1 cup | 4 | 102 | 2 g | 0.8 g | 2.6 g |
| Granola, 3/4 cup | 4 | 248 | 6 g | 3.5 g | 12.2 g |
| Oatmeal, 1 cup cooked | 1 | 145 | 6 g | 4.0 g | 0 g |
| Fruit yogurt, 8 oz cup | 4 | 231 | 10 g | 0 g | 43.2 g |
| Plain Greek yogurt, 1 container | 1 | 100 | 17 g | 0 g | 0 g |
| Cola, 12 fl oz | 4 | 152 | 0 g | 0 g | 36.8 g |
| Diet cola, 12 fl oz | 4 | 4 | 0 g | 0 g | 0 g |
For the sweetened foods, the sugar column counts all their sugar, since the USDA source gives total sugar.
Three things stand out. Whole wheat and white bread share a group, and whole wheat has about three times the fiber. Bakery sourdough is a group lower than whole wheat and has less than half its fiber. Cola and diet cola share a group, and one has 152 calories while the other has 4.
That’s why the checker never suggests swapping packaged whole wheat for bakery sourdough. The swap would lower the share of ultra-processed calories and cost you fiber.

The big study that split group 4
Three long-running US studies, the Nurses’ Health Study, the Nurses’ Health Study II and the Health Professionals Follow-up Study, followed 198,636 people, and 19,503 of them developed type 2 diabetes. In a 2023 analysis, people in the top fifth for ultra-processed food had 46% higher risk than the bottom fifth.
Then the researchers looked inside the group. Refined breads, sauces and spreads, sweetened drinks (sugar and diet alike), animal-based products and ready-to-eat dishes went with higher risk. Breakfast cereals, dark and whole grain breads, packaged sweet and savory snacks, fruit-based products, and yogurt and dairy desserts went with lower risk. The authors wrote that some groups of ultra-processed food were linked to lower risk in the US cohorts.
A cohort can’t prove any of these foods caused or prevented diabetes. But it shows that “ultra-processed” as one number blends foods that point in opposite directions.
The LDL surprise
In the 2025 England trial, 55 adults spent 8 weeks on a minimally processed diet and 8 weeks on an ultra-processed one, both built to the UK’s healthy eating guide. They lost more weight and more fat on the minimally processed diet, and their triglycerides fell more.
Their LDL cholesterol, though, came out lower on the ultra-processed diet, by 0.25 mmol/L, about 10 mg/dL. Both diets were built to the same guide from different products, and the group of the food didn’t predict which way LDL would move. LDL itself is cholesterol.guide’s subject.
Ham and whole wheat bread
The 2018 NOVA paper puts salted, cured and smoked meats in group 3, so a ham with salt and curing salt is processed, and a packaged whole wheat loaf with an emulsifier is ultra-processed. The World Health Organization counts ham as processed meat, the kind its cancer agency links to colorectal cancer. Nobody would call the ham the healthier of the two, and NOVA doesn’t either. It’s describing how each was made.
A less processed menu that wasn’t better
In a 2024 study, researchers built a typical low-quality American menu twice, once mostly from ultra-processed food and once from less processed versions of the same meals. The less processed copy got 20% of its calories from ultra-processed food, against 67% for the original. Both scored about the same on the Healthy Eating Index (44 and 43 out of 100), and the less processed copy cost more, $15.91 a day against $9.85, and spoiled sooner.
The menu’s quality came from what was on it, and changing how the food was processed didn’t change that. Processing and nutrition are two different questions, and a diet can fail either one.
Experts don’t always agree on the group
In 2022, about 160 French food and nutrition specialists sorted 120 labeled products into NOVA’s groups. Their agreement was low, a Fleiss’ kappa of 0.32, where 1 would mean everyone agreed every time. A grade built on the group would carry that disagreement into every result.
The site avoids it by never guessing. A food is group 4 when its label lists a marker from NOVA’s list, and the tools show you that marker so you can check it.
What we show instead of a score
- The group, 1 to 4, in our plain words, on four tints of one green. No color runs from good to bad.
- The deciding ingredient, the one word on the label that put a food in group 4.
- The share of calories from group 4, for a plate or a day. It’s a measure of what you ate, beside the US adult average of 53%.
- The nutrition, as its own numbers: calories, protein, fiber and added sugar.
- A link to meals.guide, which grades a whole plate on what’s in it.
When to use the group
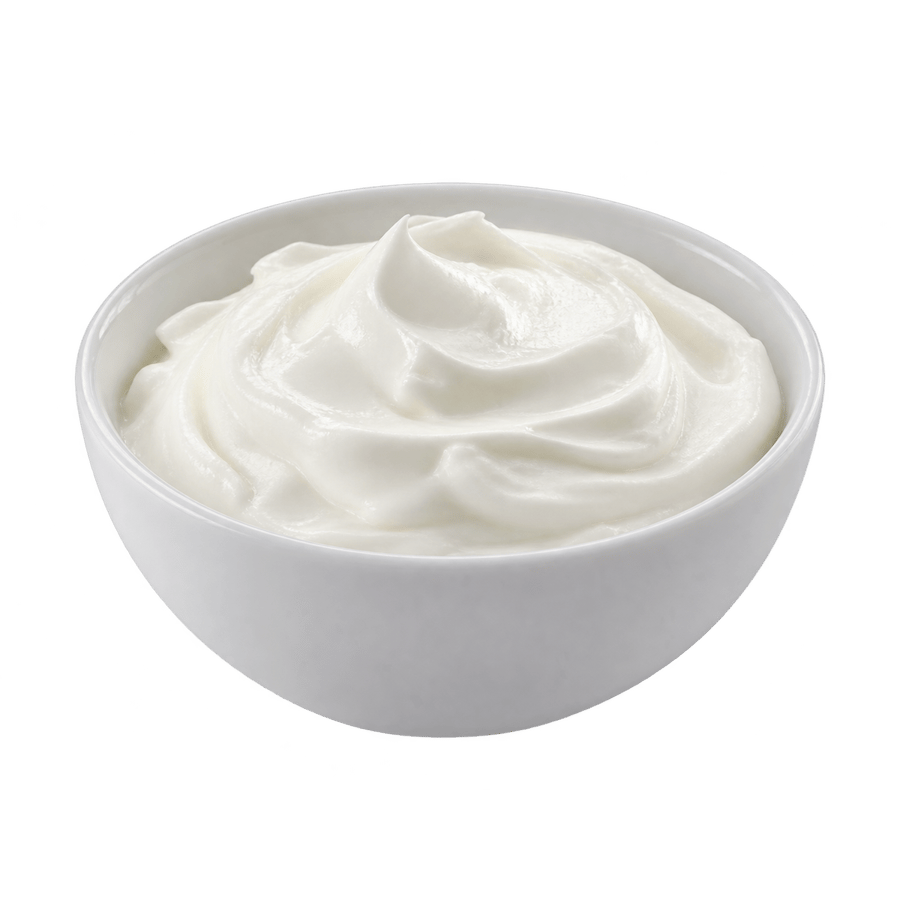
The group is good for finding swaps. Most of the time, the version of a food with nothing a kitchen wouldn’t keep also has more fiber or protein, or less added sugar. Swapping corn flakes and milk for oatmeal and milk takes the bowl from 46% ultra-processed calories to 0%, and fiber goes from 0.8 g to 4.0 g. Swapping a fruit yogurt for plain Greek yogurt and blueberries takes protein from 10 g to 18 g.
When the group and the nutrition disagree, go with the nutrition. Keep the whole wheat loaf. Keep the shake that replaces a pastry. Swap the soda first.
8 sources
- Chen et al., Ultra-processed food consumption and risk of type 2 diabetes: three large prospective U.S. cohort studies, Diabetes Care, 2023pmc.ncbi.nlm.nih.gov
- Dicken et al., Ultraprocessed or minimally processed diets following healthy dietary guidelines on weight and cardiometabolic health: a randomized, crossover trial, Nature Medicine, 2025pmc.ncbi.nlm.nih.gov
- Braesco et al., Ultra-processed foods: how functional is the NOVA system?, European Journal of Clinical Nutrition, 2022pmc.ncbi.nlm.nih.gov
- Monteiro et al., Ultra-processed foods: what they are and how to identify them, Public Health Nutrition, 2019pmc.ncbi.nlm.nih.gov
- Monteiro et al., The UN Decade of Nutrition, the NOVA food classification and the trouble with ultra-processing, Public Health Nutrition, 2018pmc.ncbi.nlm.nih.gov
- Hess et al., Using less processed food to mimic a standard American diet does not improve nutrient value and may result in a shorter shelf life at a higher financial cost, Current Developments in Nutrition, 2024pmc.ncbi.nlm.nih.gov
- Gebhardt and Thomas, Nutritive Value of Foods, USDA Home and Garden Bulletin 72, 2002ars.usda.gov
- World Health Organization, Cancer: carcinogenicity of the consumption of red meat and processed meat, questions and answers, checked 2026-11-14who.int